Our family owns and operates a 2,000 Holstein cow dairy with about 3,000 replacements and beef crosses in southwest Idaho. We also farm about 3,500 acres raising corn, corn silage, alfalfa, and cereal grain forage to feed the herd. My parents bought the 100 acres that the dairy sits on in 1960 and began to milk about 40 Guernsey cows. They transitioned to Holsteins in the 1970’s, adding cows and land when the opportunity arose.
In the last 30 years many large dairies have moved into our area which has put pressure on both the cost of labor and feed. These dairies are much larger, many thousands, even 10’s of thousands of dairy cows and they can achieve an economy of scale that I don’t have with only 2,000 cows.
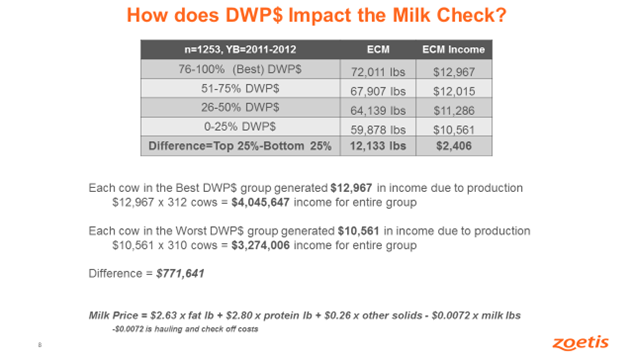
Consequently, we were searching for an effective way to be competitive and stay in business. About five years ago one of the vets that works with us, Dr. Garth Millard, proposed the idea of building a better cow utilizing Ovarian Pick Up (OPU) and In-vitro Fertilization (IVF) in conjunction with the recently developed genetic test for Holstein cows. I had some experience with the genomic test when it first came out because I had too many replacement heifers due to our successful use of female-sorted semen. We tested 1,500 Holstein heifers and used an index value, Lifetime Cheese Merit Dollars (CM$), to cull the bottom 20–25% before they freshened. Zoetis, the company that developed the genomic test, tracked the cows through their productive lifetime analyzing milk production, disease incidence, reproductive performance, and productive life. Table 1 is from a presentation that Dr. Mark Kirkpatrick from Zoetis put together using those heifers tested back in 2011 and 2012. They divided the animals that calved into quartiles based on an index metric called Dairy Wellness Profit Dollars. Females from the top quartile generate much more income than the bottom two quartiles. How do we get all of our animals into that top quartile? OPU and IVF give us the ability to greatly accelerate genetic advancement.
After we visited an OPU lab in Washington State, we consulted with the IVF lab that we wanted to use and worked with Drs. Andy and Garth to develop a plan. The veterinary clinic invested in training and equipment needed to perform the OPU procedure and we decided to begin testing the top third of our heifers based on parent average to identify donors and building a facility dedicated to OPU. As you might imagine, there were a few setbacks and surprises along the way, but the veterinarians and our management were committed to the process. Once we finally had the facility built and were producing frozen embryos, the next challenge was finding someone competent to transfer them. Fortunately, an artificial insemination (AI) company we were working with helped us train our current AI technicians and one of them became very adept at embryo transfer (ET) to embryo recipients.
Our next challenge was to get the cost of the frozen embryo as low as possible. Table 2 is a snapshot of the spreadsheet that we use to monitor the ongoing costs for us to produce a frozen embryo. For us, there are three main factors that determine the cost of an embryo:
- How many oocytes each heifer produces
- The percentage of oocytes actually recovered in our lab
- The embryo development rate (the percent of oocytes that develop into embryos)
In Table 2, the first blue column is the average number of oocytes found per donor. The next column is the total number that session that develop into embryos. As you can see, recently our average embryo per donor has been between two and five with a development rate between 16 and 40 percent. One of the keys for us to hold down the cost of an embryo is to pool donors; in other words, we will put the oocytes from two to five donors together and use one unit of semen to fertilize the group of oocytes. Therefore, we can use one fertilization for up to 70 oocytes. On the right-hand side of the table, we have the average cost per session per embryo, and the next column shows our average cost per embryo since we started about 4 years ago which is just over $114 USD. Drs. Andy, Garth, and I have spent many hours thinking about and changing the program to reduce the cost of the embryos. $115 USD per frozen embryo is very reasonable, especially considering semen from elite bulls can run over $100 USD per unit, but there is still room for improvement.
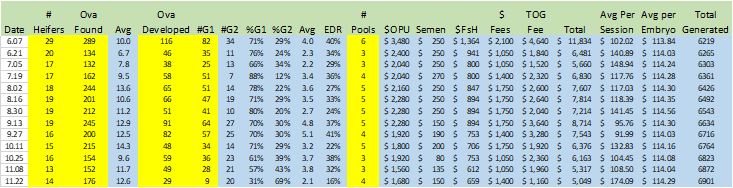
An additional factor that determines the cost to get a live calf on the ground is the transfer rate (pregnancies per transfer). By evaluating pregnancy rates (pregnancies per transfer or insemination) in both cows and virgin heifers we found that the grade one frozen embryos perform as well as Holstein semen. Pregnancy rate is reduced with grade two embryos, 15 to 20 points lower in the heifers and five points lower in the cows than grade one embryos. That is why we track the grade 1 to grade 2 ratio in the spreadsheet (Table 2). One downside to the pregnancies created using embryos is the higher abortion rate. In virgin heifers, our abortion rate with semen is 3–5%, with frozen embryos it is nearly 20%. With cows, our abortion rate with semen is 5–7% with frozen embryos it is about 10%. With all these considerations, it costs us about $300 USD more to produce a live calf with an embryo versus artificial insemination. Is this extra expense and risk justified? Referring back to Table 1 we can see that we are able to create more than enough income to justify the extra cost if we move the genetic merit of the offspring from the bottom two quartiles to the top quartile.
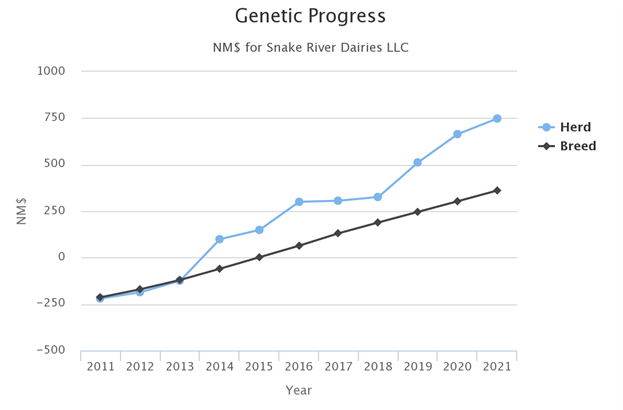
Figure 1 shows our genetic progress versus the average cow in the breed using Net Merit dollars (NM$), which is a widely accepted index here in the US. Until we started utilizing OPU and IVF, we were breed average or just slightly above. Now after just 3 or 4 years, you can see our progress has accelerated relative to the breed.
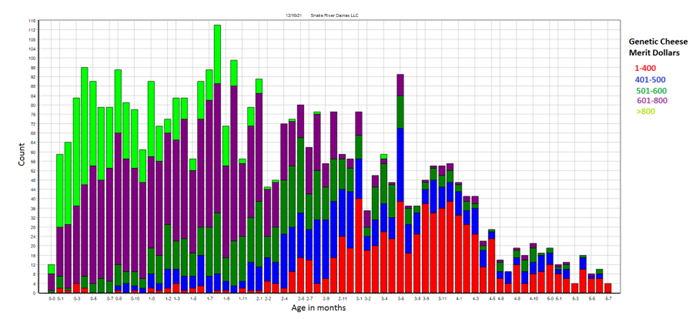
Another way to look at genetic progress is with Figure 2, which is generated from our dairy herd management software. Here we are looking at CM$, which is very similar to NM$. Each bar represents a cohort of calves born in the same month with the youngest being on the left. In the space of 3 or 4 years we have gone from most of the animals born having a current CM$ value under 400 to having nearly all above 600. Progress has been accelerated by removing average female genotypes from the genetic pool and replacing them with elite donor alleles.
One of the unexpected consequences of this technology was producing an outlier heifer calf that generated interest from AI studs; we sold her for tens of thousands of dollars to help offset some of the costs of this program. We hope that one day fairly soon we will be able to produce bulls that AI companies will be interested in.
Looking at Figure 2 you might notice a few of the lower CM$ animals, the red color, creeping in again. That is another serendipitous consequence of our adventure with this technology. Because our team has done well transferring embryos and raising the calves, we were noticed by a group of cattle breeders that are making milk cows and bulls for different markets than the commercial market that we are in. They don’t necessarily test high on the indexes we use but can be quite valuable in other situations. Those calves have just started hitting the ground, but early indications show that it could be an important source of revenue for our operation.
Does this genetic advancement translate to revenue in a commercial dairy setting? After all, that is why we decided to go to this expense and trouble, to be the most profitable, sustainable, and lowest cost producer making milk for the consumer. Table 1 shows that it is measurable and valid, but that data has been compiled and processed by the company that stands to gain from the use of the genetic test. Is there anything I can look at here on the dairy that is simple and straightforward that can tell me if we are on the right path?
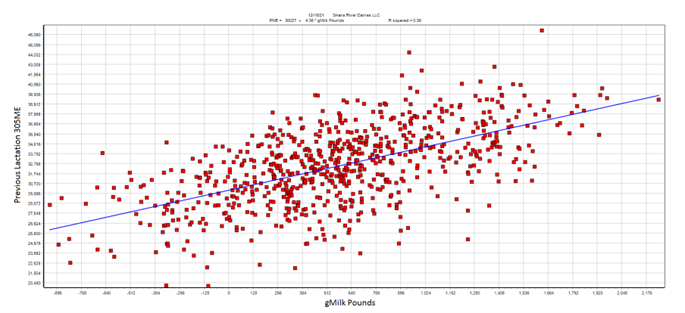
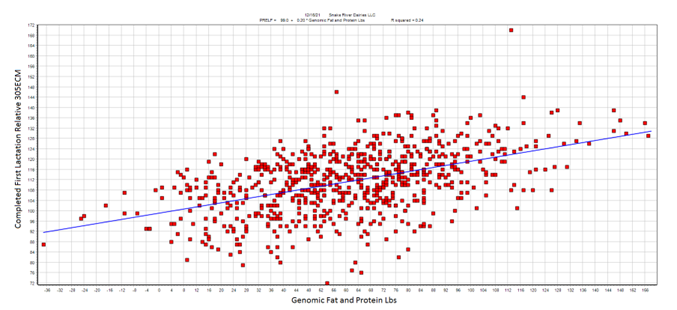
Fortunately, there are a few metrics that we can easily and accurately measure here on the dairy that correlate to specific traits from the genomic test. Figures 3 and 4 display two metrics that allow us to evaluate influence of genomic traits on cow performance. Figure 3 shows the relationship between predicted milk production and actual milk production; this scatter-plot graph displays 305 day mature equivalent production from first lactation cows that have a genomic test. Figure 4 is the same population but compares genotype to 305 day mature equivalent energy corrected milk, which adjusts their milk production based on fat and protein percentage.
In addition, daughter pregnancy rate (DPR) genotype is highly correlated with conception rate on the dairy. Cows with DPR values exceeding 1.5 have conception rates 81% higher than those below –1.5. These kinds of results give me confidence that most, if not all, the predictions are accurate.
A few things to consider before travelling down this path:
- Is my calf raising program up to par? When we started IVF-ET our calf program needed some work. We were able to make quite a bit of progress, but it really wasn’t as good as it should have been and as a result we lost too many ET calves. Nothing concentrates the mind like losing money because of poor preparation, but with some good advice and direction we were able to get things corrected quickly.
- Is there enough infrastructure, talent and facilities, for me to achieve my goals or will I have to build out or develop some expensive resources? Do I have trusted advisors that will be there to work through the problems that will arise? I was very fortunate on these fronts, especially with the people that were working with me, including family and employees.
- Obviously, the payoff for a commercial operation is several years down the road. Can I wait that long to start recovering my costs?
- One other mistake that I made was not knowing my market. Selection metrics for elite genetic calf sales are not necessarily the same as those for a commercial dairy.
My experience has been with Holsteins, other breeds may be much different as far as oocyte yield, embryo development rate and transfer rate.
Overall, the decision to use OPU and IVF-ET to advance genetic progress has been a good one. Profitability has not yet been achieved since most of the ET animals we have produced are too young to be milking, but I’m confident that our decision to build a better cow is leading to a competitive advantage with greater sustainability.