Summary
Milk recording is much more than yield, fat, protein and cell counts. Using innovative applications of mid-infrared (MIR) data, fatty acids, energy balance and ketones can now be predicted via existing milk recording services. The scale that this data collection method offers creates significant opportunities not only for dairy herd management but also for breeding purposes too. The use of genomic breeding values created from MIR data and monitoring the outcome of these breeding decisions via MIR analysis once cows have calved, provides a complete holistic approach to gaining maximum value from spectral data.
What is MIR?
Mid-infrared spectrophotometry is the process of shining an infrared beam through milk in order to determine its chemical composition. The technique has been used for over 40 years and is the same technique as that used to analyse silage samples. The process produces a spectrum, or ‘fingerprint’, of the milk sample and certain points on this spectrum relate to fats, proteins and lactose, for example.
Indeed, for several years these conventional milk constituents have been considered tools to assess the health of a cow e.g. fat:protein ratios as an indicator of negative energy balance and low butterfat percentage as sub-acute ruminal acidosis (Gengler et al., 2016). However, the limitations of relying on these ‘traditional’ traits measured via the spectrum are that they only use a very small proportion of the information available from milk spectra.
Each milk sample tested produces 1060 data points and thanks to UK and European research over the last three to five years, the insights hidden in the spectrum have been unlocked. We can now use it by calibrating milk spectra from milk samples that are accompanied by new phenotypes for the same cow.
As a result, MIR analysis allows the measurement of otherwise expensive to observe traits, such as fatty acids, energy balance or methane, for example. Thanks to the research, we can now generate our own predictions by calibrating our spectral datasets against concurrent phenotypic records. Essentially, a reference data set of ‘gold standard’ measurements are matched back to concurrent milk spectra upon which, after standardisation and modelling, a set of prediction equations are developed. These equations can then be applied to spectra from across NMR’s milk recording database to produce results for all recorded cows, with a variety of genetics and farming systems. This further analysis has included the exploration of genetic parameters and breeding values to ascertain the potential of using these new phenotypes for genetic progress.
The story so far…
Soyeurt et al., (2011) successfully demonstrated that MIR analysis can be used to quantify individual fatty acids. There are several reasons why fatty acids are of interest to dairy producers; human health, dairy product end characteristics or cow health. Originally, we were interested from a human health angle, however, with the science against saturated fat consumption now called into question, our focus turned to cow health.
All fats are not created equal
There are four possible sources of bovine milk fat: feed, rumen biohydrogenation, de novo synthesis in the udder and from body fat mobilisation. Therefore, the resulting fatty acid profile in the cow’s milk can shed light on the nutritional performance and rumen health of the cow. However, fat production will also be under genetic control, which varies over the course of a lactation. Heritabilities for certain fats have been found to vary (see Table 1) and our research with SRUC under an InnovateUK funded project, has found similar results using MIR-generated fatty acid predictions.
Table 1: Estimates of various fatty acid heritabilities
|
Cassel, B 2009 |
Soyeurt et al. 2008 (Milk) |
Bastin et al. 2012 |
Stoop et al. 2008 |
Smith et al. (unpublished) |
|
| Fat % | 0.58 | 0.26* | |||
| ME Fat yield | 0.30 | ||||
| SFA | 0.42 | 0.43 | 0.30 | ||
| MUFA | 0.14 | 0.10 | |||
| PUFA | 0.17 | ||||
| C16 | 0.41 | 0.31 | 0.29 | ||
| C18.1 | 0.08 |
(Results from Smith et al., are derived from initial analysis on 1.2 million records collected between March 2013 and October 2016, representing 113,000 cows from c. 350 herds).
*h₂ is for grams of fat per 100ml of milk.
ME = Mature Equivalent
Based on these heritability levels, there are opportunities to breed for certain milk fat profiles – if the economic case warrants it. However, genetic correlations between individual fatty acids should be considered since an increase in fat percentage doesn’t necessarily mean an increase of fatty acids across the board.
Initial estimated breeding values (EBV) suggest there is room to change your fatty acid profile by selecting certain bulls. The range in EBV’s for saturated fat for example, have an inter-quartile range from -0.28 to 0.05 (draft results, Smith et al., unpublished).
Energy traits
We’d always planned to look at the fatty acid profile in relation to energy status as greater proportions of long chain fatty acids, in particular C18:1 cis 9, have been found in cows diagnosed with sub-clinical ketosis and/or higher non-esterified fatty acids (NEFA) concentrations (Van Haelst et al., 2008). However, through our work with the European project OptiMIR, they found that this additional calculation step added another layer of potential error and that using the spectra directly was more appropriate.
Using the SRUC Crichton dairy herd as a reference population, phenotypic energy balance calculations, as per equations reported by Banos and Coffey (2010), were matched to their concurrent milk spectra to develop several prediction models. The resulting models generated correlation coefficient values of 0.84 for energy balance and energy intake and 0.76 for body energy content.
Having developed the models, these were then applied to all NMR spectra – over 9 million records! Figure 1 below demonstrates the lactation curve for energy balance, with the first lactation animals distinguished from the remainder.
Figure 1: Average predicted Energy Balance (MJ) for lactation 1 and lactations 2 to 10 (9,853,433 records across 4419 herds from January 2013 to December 2016)
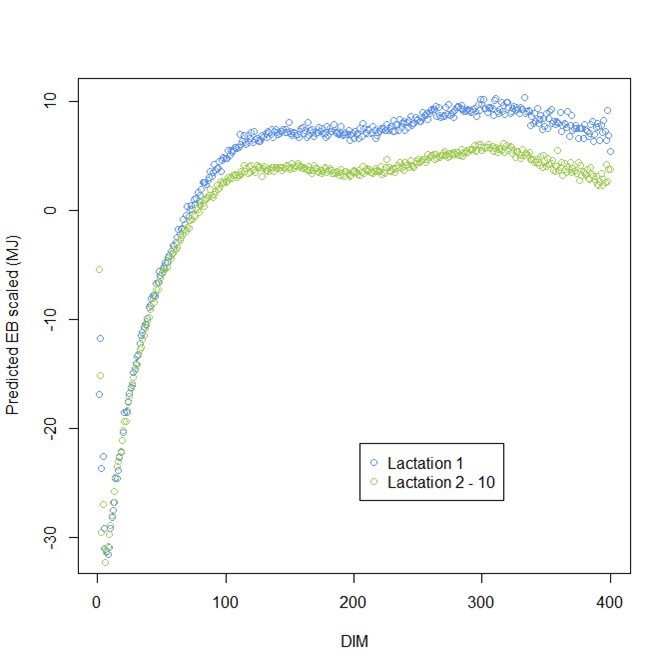
The data reveals that first lactation heifers reach zero (MJ energy balance) around day 70 of lactation, whereas older cows (2nd lactation to 10th lactation) reach zero around day 77 on average.
There is, however, huge variation on a herd to herd basis, with some herds reaching zero at 35 days and some herds over 100 days.
Breeding for a more level lactation curve when it comes to energy balance could become reality by using MIR data to develop new breeding traits. Initial genetic analysis for energy balance shows that a sire with the same PLI could have a difference of nearly 18 MJ in their PTA (Figure 2). With the heritability of energy balance calculated at 0.07, there is margin to improve the energy balance of cows via breeding once combined into an index.
Figure 2: Draft Sire PTA for energy balance against PLI
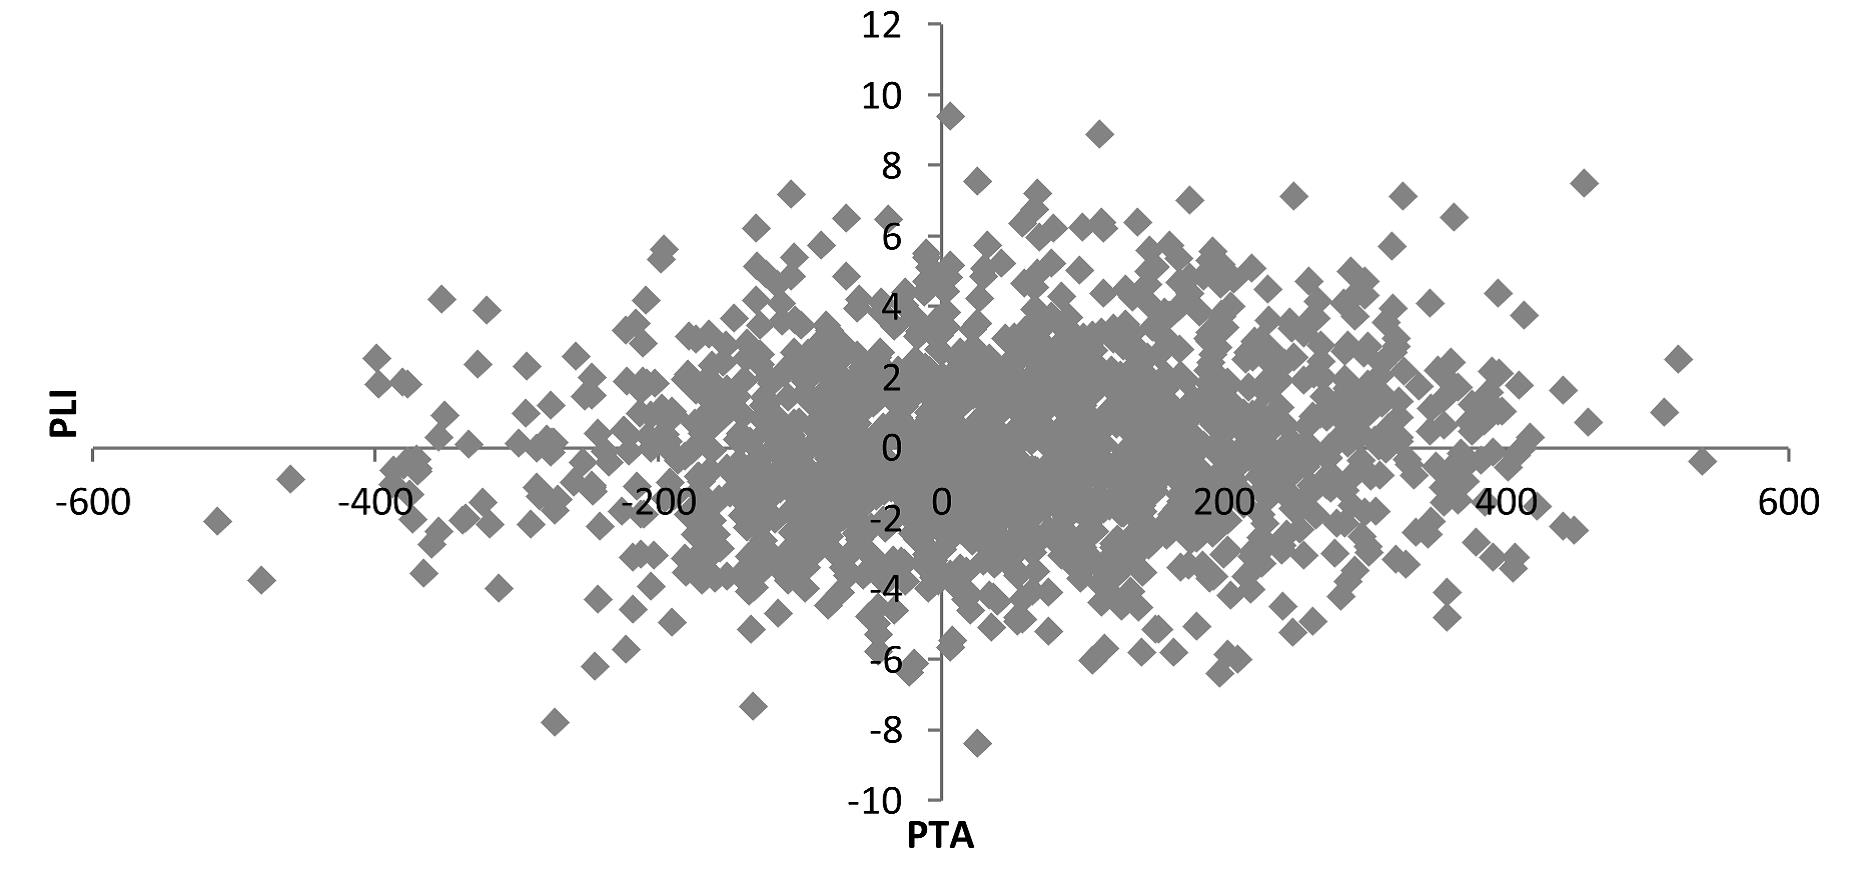
(Represents subset of c. 1500 Holstein sires, with at least 5 daughters.)
The genetic correlations for energy balance also highlight other areas that can be improved as a consequence of improving energy status. In particular, calving index shows a negative correlation meaning that by improving energy balance, calving interval is reduced.
Table 2: Estimates of genetic correlations with MIR-predicted energy balance
| Milk | 0.02 |
| Fat | 0.01 |
| Protein | 0.12 |
| Calving interval | -0.11 |
| Non-return | 0.03 |
| SCC | 0.04 |
| Lifespan | -0.01 |
| PLI | 0.13 |
(Based on 20 daughters in all traits, c. 500 bulls).
Conclusions
The initial analysis performed on the data so far shows encouraging signs that there is the potential to use MIR-derived breeding traits to improve nutritional and performance characteristics.
While the market conditions may or may not currently advocate breeding for such traits, the tools to do so should the necessity arise, have been developed and will be made available.
Next Steps
Having developed energy balance, the natural progression was to investigate the measurement of ketone bodies via MIR to give a complete picture of metabolic health. The development of MIR predictions for NEFA and betahydroxybutyrates (BHB) have been completed using both SRUC Crichton herd and commercial herd blood samples. The prediction equations will be available for NMR customers at the start of 2017 and genetic analysis will follow.
The figures presented in this paper are the results of initial exploratory work on a subset of national data. With the sharing of 9 billion rows of spectral data between NMR and SRUC, this can be scaled up to include greater variety and power to give a better overall picture of the genetic opportunities that lie in MIR data.
Once final EBV’s have been estimated, it will be possible to combine these new traits with the genomic key in order to generate genomic predictions. In this light, identification of new genomic traits is very similar to that of developing new MIR predictions. The pattern of single nucleotide polymorphisms (SNP’s) at a certain locus can be correlated with phenotypic data (in this case MIR) to locate the area of the genome which contributes to energy balance, for example. This will be a major milestone in the use of MIR data and will allow a full lifecycle to be completed; from breeding using genomic energy balance to monitoring the trait using MIR from milk recording, for example.
In the meantime, NMR will continue to develop and bring to the market, new MIR predictions that will aid dairy herd management and complement existing monitoring practices.
Acknowledgments
With thanks to Dr. Stephanie Smith and Professors Eileen Wall and Mike Coffey at The Scottish Rural University Colleges for their tireless dedication and enthusiasm for developing the capabilities of MIR. We’re also grateful for the funding received from the Scottish Government, BBSRC and Innovate UK. In addition, we thank Richard Cooper from The Evidence Group for his expertise on blood metabolites and ketosis monitoring.
References
Banos, G. and Coffey, M.P., 2010. Genetic association between body energy measured throughout lactation and fertility in dairy cattle. Animal, 4(02), pp.189-199.
Gengler, N., Soyeurt, H., Dehareng, F., Bastin, C., Colinet, F., Hammami, H., Vanrobays, M.L., Lainé, A., Vanderick, S., Grelet, C. and Vanlierde, A., 2016. Capitalizing on fine milk composition for breeding and management of dairy cows. Journal of dairy science, 99(5), pp.4071-4079.
McParland, S., Banos, G., Wall, E., Coffey, M.P., Soyeurt, H., Veerkamp, R.F. and Berry, D.P., 2011. The use of mid-infrared spectrometry to predict body energy status of Holstein cows. Journal of Dairy Science, 94(7), pp.3651-3661.
Soyeurt, H., Dardenne, P., Dehareng, F., Bastin, C. and Gengler, N., 2008. Genetic parameters of saturated and monounsaturated fatty acid content and the ratio of saturated to unsaturated fatty acids in bovine milk. Journal of dairy science, 91(9), pp.3611-3626.
Soyeurt, H., Dehareng, F., Gengler, N., McParland, S., Wall, E.P.B.D., Berry, D.P., Coffey, M. and Dardenne, P., 2011. Mid-infrared prediction of bovine milk fatty acids across multiple breeds, production systems, and countries. Journal of Dairy Science, 94(4), pp.1657-1667.
Stoop, W.M., Van Arendonk, J.A.M., Heck, J.M.L., Van Valenberg, H.J.F. and Bovenhuis, H., 2008. Genetic parameters for major milk fatty acids and milk production traits of Dutch Holstein-Friesians. Journal of Dairy Science, 91(1), pp.385-394.
Van Haelst, Y.N.T., Beeckman, A., Van Knegsel, A.T.M. and Fievez, V., 2008. Short communication: Elevated concentrations of oleic acid and long-chain fatty acids in milk fat of multiparous subclinical ketotic cows. Journal of dairy science, 91(12), pp.4683-4686.