Introduction
Lame cows produce between 300 and 600 fewer litres of milk per lactation (Coulon et al., 1996; Amory et al., 2008), take 20 to 40 days longer to get back in calf (Argaez-Rodriquez et al., 1997; Hernandez et al., 2001), and are more likely to be culled (Machado et al., 2010). This makes lameness one of the most costly challenges faced by British dairy farmers today as well as a major welfare concern of the industry. Numerous studies taking place over a number of years from 1989 to 2014 have found a range of average prevalence of lameness in the UK dairy herd from 18% to 37% (Rutherford et al., 2009; Barker et al., 2010).
In 2011, AHDB Dairy launched the Healthy Feet Programme to assist farmers in reducing lameness in their herd. A recent study on 44 dairy farms showed that there was a reduction of lameness events by one fifth after one year of implementing the Healthy Feet Programme. Although these industry measures are reducing incidence levels in the UK dairy herd, they are only addressing the cause at the management level.
The UK has improved health traits in the dairy herd through breeding since 1999 with the inclusion of lifespan, SCC and daughter fertility in the national breeding index. Selection on these low heritability traits has seen improvement in the national herd with a reduction in SCC and improvements in fertility traits and productive lifespan. Previous studies have found lameness to be a low heritability trait, ranging from 0.10 to 0.19 (Boettcher et al., 1998; Kadarmideen et al., 2000). Therefore the development of a breeding index for lameness will further assist the improvement that has already occurred as a result of better management practices. This paper will outline the work undertaken thus far to develop such a breeding index for the UK dairy industry.
Data sources
Farmer recorded lameness events were available through UK Milk Recording Organisations (MROs); National Milk Records (NMR) and Cattle Information Services (CIS). These events indicate if the cow had a foot problem or was lame at milking. Conformation data was also available from the Holstein UK herdbook classification records. The conformation records used in the analysis included rear leg side view, foot angle, body condition score, locomotion, overall feet and leg score and bone quality.
Genetic parameter estimates
Data
All Holstein cows with lactation 1 to 5 data were selected if they had experienced a lameness event, along with their contemporaries. This gave ~169 000 animals which had experienced at least one lameness event, ~325 000 lameness events, ~818 000 contemporaries contributed ~5.9 million records. For parameter estimation, the following restriction criteria were applied;
- Dropped records with unknown sire or dam
- Sire had at least 10 daughters in data
- Oldest 500 daughters were retained
- Dropped animals with missing heifer conformation classifications
- Retained animals with first and consecutive lactations
- Dropped contemporary groups without a lameness event
- Dropped contemporary groups containing less than 5 records
This left a data set containing ~56 000 records, of which ~14 000 were lameness events. These records related to ~35 000 animals of which ~10 000 had experienced at least one lameness event.
Model terms
An animal repeatability model was fitted for the genetic parameter estimates. Lameness was treated as a binary trait with 0 indicating that the animal was not lame and 1 indicating that she was lame at least once through her lactation. The full model fitted was as follows;
y = Xb + Za + Zp + e
where y is a vector of lameness observations coded as 0 for not lame and 1 for lame, b is a vector of fixed effects consisting of the herd-year-season of calving, lactation number and age at calving in months, a is a vector of random animal effects with an assumed distribution of N(0,σ2aA), p is a vector of random permanent environmental effects with an assumed distribution of N(0,σ2pA), e is a vector of residual effects with an assumed distribution of N(0,σ2eI), and X and Z are incidence matrices.
Results
A heritability of 0.09 with 0.02 standard error was found. This result was comparable to a heritability of 0.08 found in a pilot study when a sire model was fitted using data from one MRO.
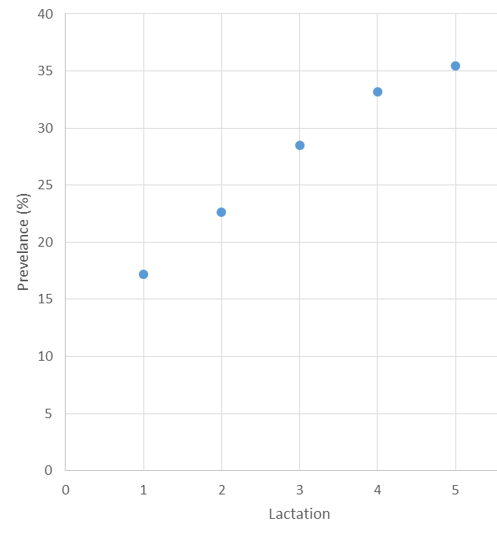
Figure 1 illustrates the prevalence of lameness found in the data set used for the genetic parameter estimates.
Figure 1: Prevalence of lameness by lactation in genetic parameter estimation data set.
EBV estimates
Data
The same raw data set had the following criteria restrictions applied;
- Dropped records with unknown sire
- Dropped contemporary groups without a lameness event
- Dropped contemporary groups containing less than 5 records
These restrictions resulted in a data set containing ~946 000 animals, of which ~167 000 had at least one lameness event. In total the data set contained ~8.7 million records and ~322 000 lame events.
Model terms
Again, an animal repeatability model was fitted however instead lameness was treated as a binary trait with multiple records per lactation. Again, 0 indicated that the animal was not lame and 1 indicated that she was lame at the time of milk recording. The full model fitted was as follows;
y = Xb + Za + Zp + e
where y is a vector of lameness observations coded as 0 for not lame and 1 for lame, b is a vector of fixed effects consisting of the herd-test-month of observation, season of calving, days in milk, lactation number and age at calving in months, a is a vector of random animal effects with an assumed distribution of N(0,σ2aA), p is a vector of random permanent environmental effects with an assumed distribution of N(0,σ2pA), e is a vector of residual effects with an assumed distribution of N(0,σ2eI), and X and Z are incidence matrices.
Results
EBVs were estimated for ~55 000 sires, ranging from -0.64 to 0.55. Figure 2A illustrates the distribution, with a median of 0.001 and standard deviation 0.06.
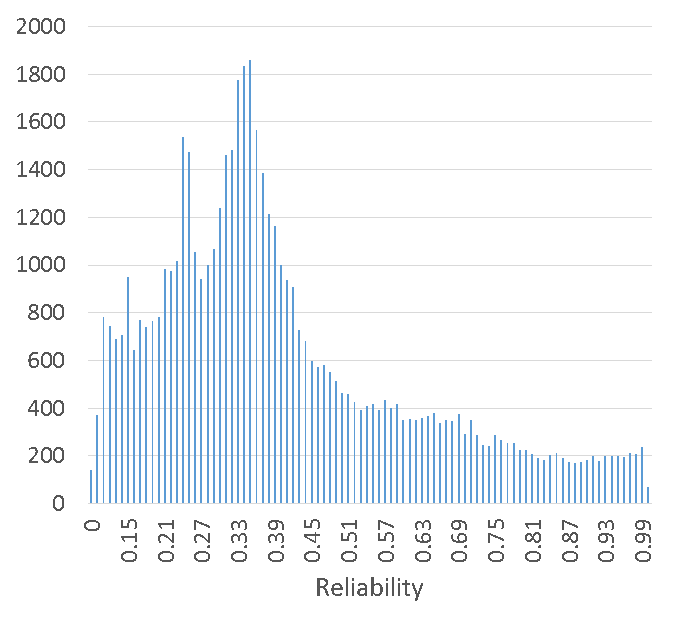
Reliabilities ranged from 0 – 0.999 with median 0.35 and standard deviation 0.21. Figure 2B illustrates the distribution of reliabilities.
Figure 2A: Distribution of lameness EBVs for ~55 000 sires
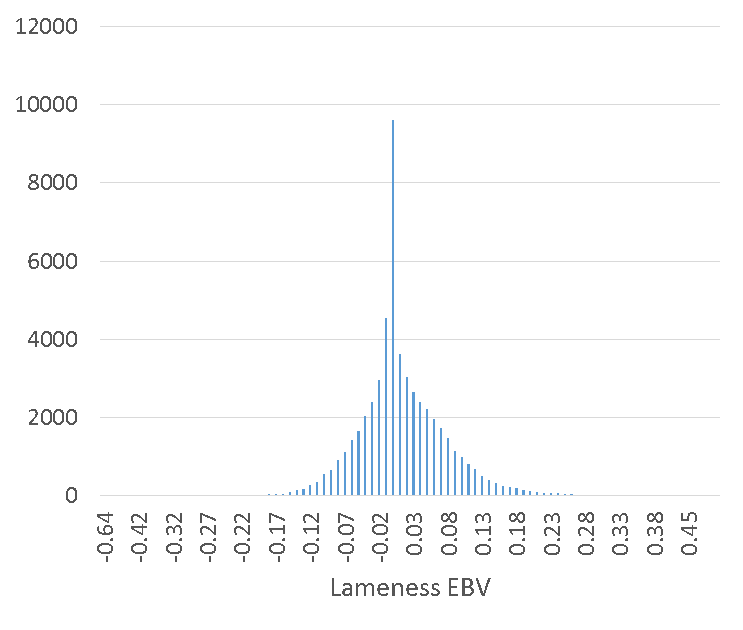
Figure 2B: Distribution of lameness reliabilities for ~55 000 sires.
Preliminary genetic correlations
Genetic correlations were calculated between a selection of linear type traits; Rear Leg Side view, Foot Angle, Body Condition Score, Locomotion and Overall Foot and Leg; and lameness in lactation 1. Table 1 illustrates the relationship direction between lameness in lactation 1 and each linear type trait. The size of some correlations were unexpected so these values have not been presented.
Table 1: Preliminary correlations between linear type traits and lameness in lactation 1.
| Lameness in Lactation 1 | |
|---|---|
| Rear Leg Side View | - |
| Foot Angle | + |
| Body Condition Score | + |
| Locomotion | - |
| Overall Foot and Leg | - |
Discussion
The trend shown in Figure 1 for prevalence of lameness across lactations in our data set closely reflects the trend shown in the UK national herd. This indicates that the data set used for parameter estimates is representative of the national population.
The EBVs expressed in Figure 2 relate to the percent of daughters which will experience a lameness event in their lifetime. For example, by using a bull with -0.1 lameness EBV it is expected that 10% fewer daughters of this bull will experience a lameness event in their lifetime compared to a 0 lameness EBV bull.
A minimum restriction on reliability is proposed before publishing a lameness EBV. In the case of the preliminary lameness EBVs, around 47 000 of the 55 000 sires with a lameness EBV had a reliability greater than 20%, which is recommended as the publication cut-off.
A number of the genetic correlations between linear type traits and lameness in the first lactation were larger than expected and not all in the direction expected either. These will be looked at again in future work on this project and compared to correlations found by countries currently evaluating hoot health traits.
Conclusions and future work
This study has shown that lameness, as a binary trait recorded by MROs, is a lowly heritable trait, with the volume of data available being sufficient to development national genetic evaluations for lameness. Further work is still required to determine the lameness trait definition – whether lameness should be evaluated as a single event (model used in genetic parameter estimates) or multiple events (model used in EBV estimates) within a lactation.
Work is ongoing to estimate genetic correlations between lameness events and finalise the genetic correlations between lameness traits and linear type traits, with the aim to improve the accuracy of lameness EBVs. In addition, Digital Dermatitis has been recorded as part of the Holstein UK classification system and is intended to be reviewed and included in further analyses.
Hoof trimmer data is also available. A feasibility study has been conducted to determine whether this can also be included in the evaluations. Although the date shows promise, this data is not standardised and a lower number of records are available compared to the MRO records. These two factors present issues which will need to be overcome before this data can be included.
Finally, over 4 000 of the sires assigned a preliminary EBV also have a genotype. Of these, ~3 800 had a lameness reliability greater than 30% with over half of these sires having a lameness reliability greater than 50%. This number of sires with a genotype and high reliability indicates that a genomic evaluation for lameness could also be on the table.
Acknowledgement
Suppliers of milk recorded information; National Milk Records (NMR) and Cattle Information Service (CIS).
Supply of type data; Holstein UK (HUK).
Co-workers on the project to date of presentation; Dr Alex Brown (EGENES), Karolina Kaseja (EGENES), Prof. Raphael Mrode (SRUC/EGENES) and Marco Winters (AHDB).
References
Amory, J.R., Barker, Z.E., Wright, J.L., Mason, S.A., Blowey, R.W., Green, L.E., 2008. Associations between sole ulcer, white line disease and digital dermatitis and the milk yield of 1824 dairy cows on 30 dairy cow farms in England and Wales from February 2003 to November 2004. Preventive Veterinary Medicine 83, 381 – 391.
Argaez-Rodriquez, F.d.J., Hird, D.W., Hernandez de Anda, J., Read, D.H.,
Rodriguez-Lainz, A., 1997. Papillomatous digital dermatitis on a commercial dairy farm in Mexicali, Mexico: Incidence and effect on reproduction and milk production. Preventive Veterinary Medicine 32, 275 – 286.
Barker, Z.E., Leach, K.A., Whay, H.R., Bell, N.J., Main, D.C.J., 2010. Assessment of lameness prevalence and associated risk factors in dairy herds in England and Wales. Journal of Dairy Science 93, 932 – 941.
Boettcher, P.J., Dekkers, J.C.M., Warnick, L.D., Wells, S.J., 1998. Genetic analysis of clinical lameness in dairy cattle. Journal of Dairy Science, 81, 1148 – 1156.
Coulon, J.B., Lescourret, F., Fonty, A., 1996. Effect of foot lesions on milk production by dairy cows. Journal of Dairy Science 79, 44 – 49.
Hernandez, J., Shearer, J.K., Webb, D.W., 2001. Effect of lameness on the calving-to-conception interval in dairy cows. Journal of the American Veterinary Medical Association 218, 1611 – 1614.