Introduction
Meat quality encompasses a multitude of factors including safety, nutritive value, lipid content and composition, however, the focus of this study is on the palatability factors such as juiciness, tenderness and flavour. Meat quality is becoming more important as consumers worldwide are increasingly demanding consistently higher quality meat. Consumer tracking data (Pelegrin Research Group, 2014; Lusk and Murray, 2015) suggest that ‘taste’ is number one attribute for majority of consumers and is the primary reason consumers purchase beef when compared with other types of meat. Recent research also shows that consumers want to ‘trade up’. In the USA, Certified Angus Beef ® (CAB) increased by 112 percentage points between 2009 and 2014, whereas demand for commodity Choice beef declined by 2 percentage points (Zimmerman and Schroeder, 2013; Suther, 2015). Despite consumers showing a willingness to pay more for a better eating quality experience, cattle finishers are generally not rewarded for eating quality apart from some breed premium schemes. Given that a recent study is showing that there is more variation within breeds for meat tenderness than between breeds (Koohamaraie et al., 2005), there is a need to look at eating quality for all breeds.
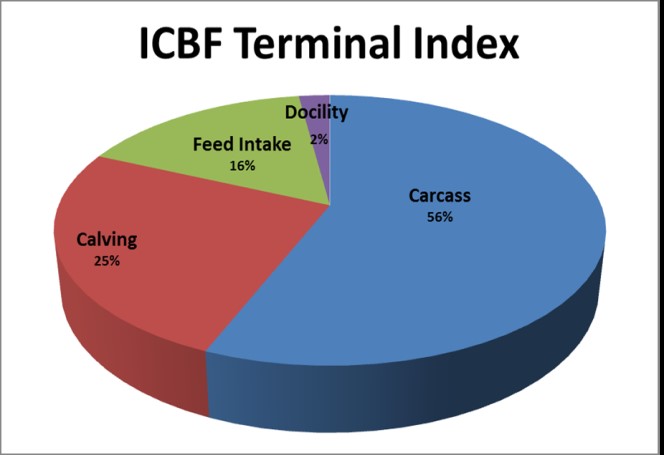
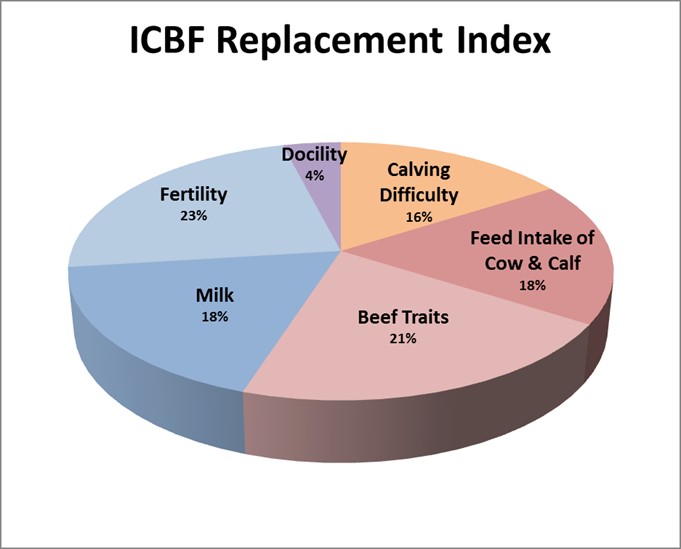
In Ireland Beef farmers have achieved great success and increased farm profits by selecting animals through the Irish Cattle Breeding Federation (ICBF) €uro-Star or profit Indexes. These indexes allow farmers to select and purchase the most profitable animals for terminal and maternal traits (Figure 1). Each of the important profit traits is given a weighting for the respective index and a monetary value is put on each trait. This is then calculated to give an overall figure that shows the potential financial impact of using a bull in your herd. If you take the Charolais bull Pirate (AI code: PTE) as an example. Pirate has a terminal index of €135. This means that Pirate’s progeny will leave €135 extra profit at slaughter over the average animal. Pirate has a maternal (replacement) index of €100. This means that Pirate daughters that are used for breeding will leave €100 extra profit above the average suckler cow, over the course of their lifetime (all of their calves and their slaughter value). It is important to remember that these are average figures, therefore, on farms where management and performance are very high, Pirate progeny may leave a lot more profit than the index suggests. By the same token, on farms where management and performance are poor, Pirate progeny may well leave a lot less profit than the average. Although meat eating quality is not included in the current €uro-Star indexes, ICBF recognises that meat eating quality is becoming ever more important based on recent research and also with the introduction of breed premium schemes in Ireland for Angus, Hereford and Shorthorn breeds.
There has been significant improvements in meat eating quality over past 10 years through animal handling, slow-chilling, hip-hanging and dry-age process. However, genetic influence for meat eating quality needs to be further explored as genetic improvement is cumulative and permanent. Therefore, the objective of the study is to quantify the influence of genetics on meat eating quality and identify the best sires for the trait to be used in the national breeding program.
Figure 1: Trait weightings for ICBF Terminal and Replacement indexes.
Data collection
As part of the Irish national beef progeny testing program located in Kildare town, Co. Kildare, approximately 500 crossbred progeny are tested each year. These animals are all selected from AI sires and data collected includes growth rate, feed intake and ultrasonically scanned measurements. Bulls are fed an adlibitum concentrate diet and the steers are offered 8 kilos of concentrates and 5 kilos of hay on fresh-weight basis per head per day. Animals spend a total of 120 days at the centre. During the first 30 days they are acclimatised to their diet and surroundings while the next 90 days they go on their performance test. Bulls are slaughtered between 16 and 18 months of age with the steers slaughtered between 17 and 24 months of age. Following completion of the test, all animals are slaughtered in batches of approximately 50 cattle, all at the same abattoir and to perislaughter protocol and specifications. In total meat quality phenotypes were collected on 1508 animals (1168 bulls and 340 steers). This data included primal yields, pH measure ments, colour and marbling of the loin, shear force measurements, compositional analysis (moisture %, intramuscular fat % and protein %) along with sensory analysis. In order to carry out the compositional and sensory analysis a total of 6 steaks, each 2.54 cm thick, are taken from a boned section of the Longismuss dorsi muscle on the right hand side of each carcass. All sensory analysis was undertaken by a commercial company (Eolas International Ltd. Cork, Ireland). Using the assessment sheet provided, the steak sample was scored for tenderness, juiciness and flavour on a scale of 1 (extremely tough, not at all juicy and off-note) to 9 (extremely tender, juicy and flavoursome). There were 6 to 8 panellists per panel, and each panel consisted of two sessions with a minimum 10-minute break between sessions. All analysis carried out to date has focused on trained sensory panel work.
Heritability
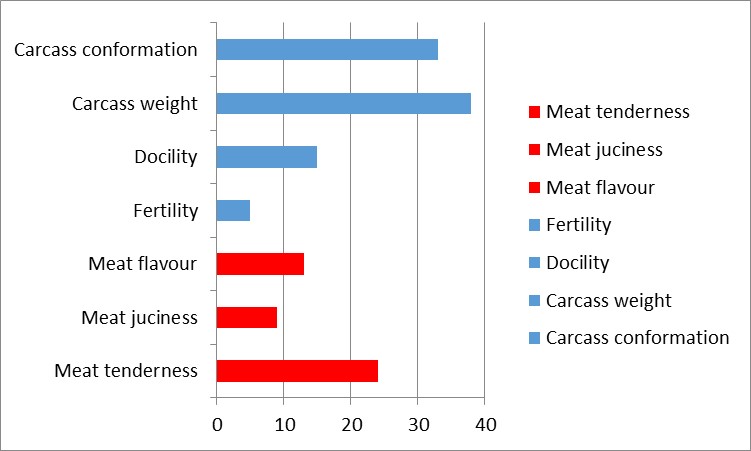
In order to make genetic progress a trait must be heritable. A heritable trait is one that is passed from a parent to offspring. The more heritable the trait, the more it can be affected by breeding. Overall the heritability’s of 23%, 8% and 13% for consumer important traits such as tenderness, juiciness and flavour, respectively were found to be in line with international studies. Heritability for these sensory traits is very encouraging when compared with other common traits such as fertility, conformation and docility (Figure 2) where substantial progress has been made over the last 10 years through breeding. These heritability’s show that we can make progress through breeding and that breeding has an important role to play in eating quality of beef.
Figure 2: Heritability estimates for a selection of meat quality traits.
Breed differences
Interestingly, results using trained taste testers show that no one breed is out performing another in terms of tenderness (Figure 3). These results were based on 1040 progeny from AI sires across 7 different breeds. Therefore, within every breed there are animals that produce high eating quality tender beef and likewise animals whose meat is of a lesser quality. The only exception was for Simmental sired progeny where the average EBV for tenderness was one full score lower than the average for Hereford, Belgian Blue and Angus. We can now identify the top AI bulls that progeny will produce more tender beef (Figure 4) where we have sensory phenotypes on 15 or more progeny from that bull. The plan is to put a proposal forward to industry to incorporate meat eating quality traits into the Beef !uro-Star indexes andpublish evaluations for eating quality in 2018. The sooner we reward bulls for eating quality the quicker we can make progress in lifting Irish Beef to a higher standard that will deliver higher prices for Irish Beef internationally and ensure it is sold into the highest priced markets.
Figure 3: Tenderness EBV by breed.
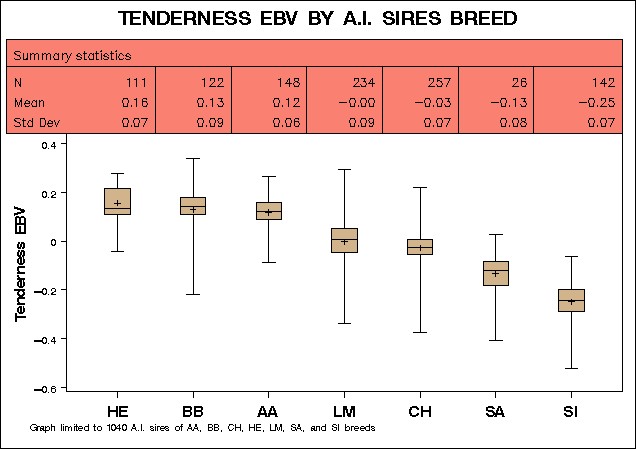
Figure 4: Top AI bulls in Ireland for tenderness.
| Breed | International ID | Name | Birth year |
| Angus | AANIRLM121657620895 | LISDUFF DANDY K895 | 2010 |
| Belgian Blue | BBLBELM000455716400 | KUBITUS DE BRAY | 2009 |
| Charolais | CHAFRAM008130562111 | ULRICH | 2003 |
| Hereford | HERGBRM700495200634 | DENDOR 1 KOHINOOR PP | 2012 |
| Limousin | LIMFRAM003615030964 | ROCKY | 2000 |
| Salers | SALFRAM001998004082 | CORLURGAN OURSON | 1998 |
| Simmental | SIMAUTM000276570944 | ENFIELD HURRICANE HUGO | 1988 |
Consumer validation work
Based on the parentage information and trained taste test panellist’s results, each animal was assigned an EB (economic breeding value) for meat eating quality. At present, the value is simply a numeric figure to one decimal place. The next step is to assign a monetary value to each unit on the beef eating-quality index. In other words, disseminate the financial gain for breeding an animal with genetic potential to produce high-quality beef.
The index was tested on the general public at a Teagasc BEEF 2016 Open day which took place in Grange research center, Dunsany, Co. Meath (Table 1). Consumers were selected at random and each offered two pieces of steak, both being from bulls of the same breed, but one from a bull belonging to a high beef-quality genetic line and the other from a bull scoring lower in terms of genetic beef eating quality i.e. lower EBV for eating quality. Tasting was blind and tasters were asked to pick the better-quality beef of the two. The test was repeated seven times with different consumers for each pair of bulls. The results are outlined in Table 1. Tasters agreed with the beef quality index 75% of the time. To put this in perspective, when marketing meat, supermarkets would be happy with 15–20% agreement in similar tests of eating quality.
As well as the high rate of consumer agreement with the index, the Grange test was interesting in that its results corresponded with the index whereby breed had little effect. Within the Aberdeen Angus comparison, all seven tasters agreed with the index when selecting their favourite, which shows that within the breed there is high and low eating quality beefproducing sires. Given that these bulls were raised and slaughtered under similar conditions and were of similar ages and carcase grades any differences is purely down to genetics.
Table 1: Blind taste testing consumer results for high and low genetic merit animals for eating quality.
| ICBF consumer tasting session, Teagasc Grange BEEF 2016, 5 July 2016 | ||||||||
| High easting-quality steak | Low eating-quality steak | Consumer selected "high" | ||||||
| Pair | Breed | Tag No. | EBV | Breed | Tag No. | EBV | High EBV | Low EBV |
| 1 | BB | 176 | 3.3 | BB | 402 | -0.3 | 5 | 2 |
| 2 | CH | 119 | 3.6 | CH | 957 | -3.2 | 6 | 1 |
| 3 | CH | 305 | 2.8 | CH | 943 | -3.6 | 5 | 2 |
| 4 | LM | 188 | 2.9 | LM | 485 | -4.0 | 7 | 0 |
| 5 | LM | 190 | 2.5 | LM | 414 | -2.9 | 4 | 3 |
| 6 | LM | 537 | 2.2 | LM | 956 | -5.6 | 6 | 1 |
| 7 | SA | 183 | 1.7 | SA | 191 | -1.6 | 7 | 0 |
| 8 | AA | 291 | 2.3 | AA | 234 | -2.4 | 7 | 0 |
| 9 | BB | 311 | 2.6 | BB | 412 | 0.0 | 3 | 4 |
| 10 | CH | 966 | 3.0 | CH | 536 | -3.0 | 5 | 3 |
| 11 | CH | 193 | 2.2 | CH | 680 | -0.1 | 3 | 4 |
| 12 | LM | 300 | 2.4 | LM | 947 | -1.0 | 5 | 3 |
| 13 | LM | 317 | 2.2 | LM | 240 | -0.1 | 6 | 2 |
| 14 | SI | 647 | -0.2 | SI | 644 | -6.7 | 6 | 1 |
| 2.4 | -2.5 | 75 | 26 | |||||
Conclusion
Meat eating quality exhibits genetic variation with no differences between breeds apart from the Simmental breed. Given the moderate to strong heritability’s for sensory traits, genetics and selecting suitable sires will play an important role in improving eating quality. However, all stages of the food chain can affect meat quality. Therefore, in order to produce consistently high eating quality beef everyone involved in the food chain has to work together to ensure consumers consume more beef and are willing to pay appropriately in order to return a profit to all involved. In relation to future work there is a need to collect more data and carry out further analysis, especially on more routinely available predictors (pH, shear force, image data etc) along with assigning a monetary value for each unit increase in eating quality with a view to publishing a genetic index for eating quality in 2018. The role of genomics as a predictor of animals with good eating quality attributes also needs to be explored. Given the excellent industry engagement in the collection of relevant phenotypes Ireland seems to be in a strong position to achieve these goals.
References
Koohmaraie, M., Schackelford, S.D. and Wheeler, T.L. (2005). Biological bases that determine beef tenderness. Proc. 9th World Angus Forum. Cape Town, South Africa. 39–45.
Lusk, J. and Murray, S. (2015). Food Demand Survey. Vol. 3, Issue 7, Nov. 16, 2015. http://agecon.okstate.edu/faculty/publications/5122.pdf.
Pelegrin Research Group (2014). Consumer Insights Report, Consumer Beef Index, July2014. http://www.beefresearch.org/CMDocs/BeefResearch/MR_Presentations/ReportConsumerBeefIndexJuly2014v3-Versiongeneraldisseminationrev.pdf.
Suther, S. (2015). Beef demand index: consumers crave quality. Defining and quantifying Certified Angus Beef ® brand consumer demand. http://www.cabpartners.com/articles/news/2862/Mkt_CAB_Demand14NR.pdf.
Zimmerman, L.C. and Schroeder, T.C. (2013). Defining and quantifying Certified Angus Beef ® brand consumer demand. http://www.cabpartners.com/articles/news/2558/REVISION_FINAL_
Certified%20Angus%20Beef%20Consumer%20Demand.pdf.